Look at This!
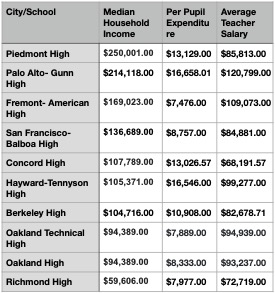
Expenditure data is from SARC reports filed with CDE
We are told that school funding in California is equal, but the table above shows that this is a lie. Due to the combined effects of parcel taxes (SN #15), Basic Aid (this issue), different access to school construction bonds (this issue), and different percentages of administrative costs, communities with higher average income spend more per student on schools: the higher the income, the higher the spending. (But look at SF and Hayward, above).
This is the same pattern, in almost the same ratio, that existed befrore the state Supreme Court ruled in 1971 (Serrano vs. Priest) that unequal school funding violated the state constitution. The state has not really equalized funding, just better concealed the inequality.
Teacher compensation also is higher in richer communities. Differing union locals and community attitudes mean that is not as lock-step as per-pupil funding but the result is still that the districts with the most vulnerable students have the lowest salaries. Many teachers move to wealthier districts to survive economically, so the poorer districts also have the highest teacher turnover. Students from poor families, and their teachers, still get the short end of the stick.
See also the articles on Parcel Taxes (#15) and Basic Aid and construction bonds in #17.
One response to “Is School Funding Equal?”
-
[…] Aid” Districts. I’ve written about funding inequality in Solidarity News before (SN Oct 2024, 2022 numbers). The EdSource article has more details and numbers than SN could produce, but […]
LikeLike


Leave a Reply