When we argue for increased spending on public education we often say that “the fifth largest economy in the world” can easily afford to adequately fund schools. So we’re talking about education spending as a percentage of total economic activity (Gross Domestic Product, GDP) which I’m abbreviating as % GDP. California spends less than 3% GDP while Vermont spends 5% GDP. California could afford to spend a lot more on education— but does that make %GDP a good way to look at education funding?
Last year California spent the most dollars on education in its history and the lowest % GDP since 1948. (from Ed101). Taxes grew, and Prop 98 required the state to spend correspondingly more on education, but the state economy grew faster. This got me thinking about arguing for 5% of GDP spent on education as way to frame our funding argument so I started looking for information.
It turns out that % GDP provides some interesting insights, but it also has some flaws. Below are charts of % GDP spent on education by 1) US states and 2) OECD countries, with some comments. Many of these comments come from a discussion by the Solidarity News editors when we looked at these charts.
California definitely looks bad here— it’s the ninth from the bottom. Vermont and New Jersey spend more % GDP and that leads more funding per student and better educator salaries. But as you look farther down the table things get more complicated. Mississippi is ninth from the top even though its schools spend the least per pupil of any state; it’s the poorest state, so even a high % GDP doesn’t result in adequate funding. Using % GDP disguises the economic inequalities between states.
Using % GDP as an overall measure then implies that rich states, like California, can fund education but that poor states, like Mississipi, can’t. We need a federal funding structure that evens this out, not each state alone. To fund equal education for all, California would have to put in a higher % GDP.
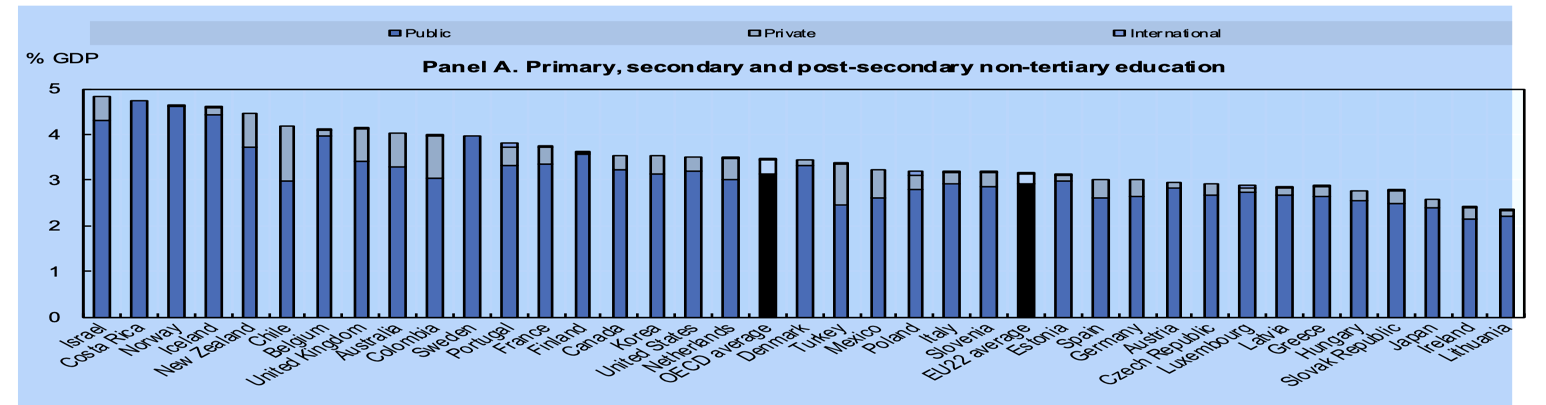
Looking at % GDP by countries (only rich and middle-income countries are included here, with bias toward Europe— it’s what I could find.) is also interesting, and not all what you would expect.
The distribution is just like that of states, ranging from a little below 3% up to 5%. The US average is just barely above the average for all these countries.
The top two countries are Israel and Costa Rica. Israel supports a well-funded system of Orthodox Jewish schools in addition to the public schools. Costa Rica is a relatively poor country that abolished its military in 1948 and can therefore spend a much higher percentage of tax dollars on education (hmm— maybe we should try that).
Then we get Norway, Iceland and New Zealand— more like what we might have expected. But after that we get to Chile and some other countries with highly privatized and deeply unequal educational systems— the funding for public schools is much lower.
Finland, which has one of the world’s best school systems spends only a little more % GDP than the US while Costa Rica spends a relatively high % GDP but has schools that US educators would see as inadequate.
We need to find ways to talk in terms of educational adequacy, not financial feasibility.
David de Leeuw, OEA retired

